
Check our case study
Extending Architecture & Automation Capacity2025-2026 BENCHMARK REPORT FOR DIGITAL TRANSFORMATION FIRMS
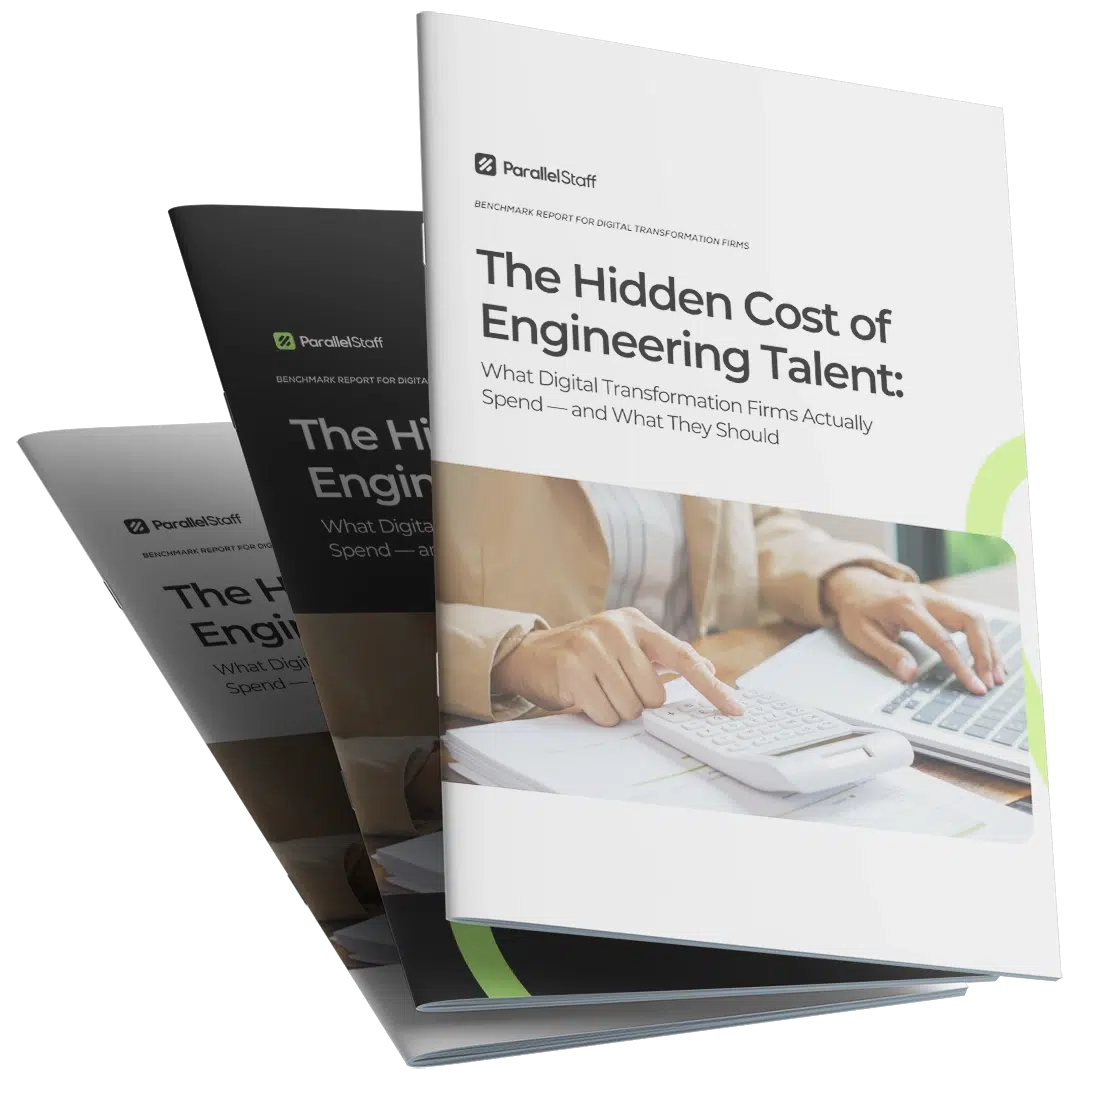
The hidden cost of engineering talent
What digital transformation firms actually spend — and what they should
A fully-loaded cost model built on BLS, McKinsey, and CompTIA data — so you know exactly what your engineering team costs, and what it should.
87%
of U.S. tech leaders struggle to find skilled workers
Source: Robert Half, 2025
$5.5T
in projected losses from IT skills shortage by 2026
Source: IDC / TechTarget, 2025
61 days
average time-to-hire for a software developer in-house
Source: ManpowerGroup / Alcor, 2024
1.2M+
software engineer vacancies expected in U.S. by 2026
Source: U.S. BLS Outlook, 2024
What's an unfilled engineering role actually costing you? Most leaders guess wrong — by $40,000 or more.
The talent math your firm is running is probably broken. Not because your team isn't sharp — but because most firms have never actually modeled what a U.S. engineering hire fully costs, end to end.
This report does it for you. It benchmarks the true, fully-loaded cost of onshore talent, quantifies what every open seat is costing you in delivery capacity, and shows you what a nearshore-augmented model actually looks like in practice.
Here's what operating without this data is costing you right now:
You're underpricing engagements
because your cost-per-engineer model doesn't include recruiting cycles, ramp time, benefits burden, or manager overhead
Open roles aren't just annoying
they're ~$45K liabilities per seat — in lost billable capacity alone, before you count client satisfaction impact
You're staffing reactively instead of strategically
and reactive hiring during a delivery crunch costs 40–60% more than a proactive nearshore model
Your team is doing the math wrong on nearshore
dismissing it on rate card alone without accounting for time zone overlap, ramp speed, and turnover savings
Every delayed sprint is a delayed invoice
on a $500K milestone engagement, two sprints of delay is $50K–$80K in deferred revenue sitting on your P&L
Built by practitioners, not pundits.
ParallelStaff has placed engineering talent at companies including AT&T, Google, AMD, and Whirlpool. This benchmark report was built from that operational experience — combined with 18 primary data sources — to give digital transformation leaders a model they can actually use, not just read.






You don't need another opinion on the talent market. You need the numbers.
This report gives you exactly that — a sourced, benchmarked cost model built on BLS, SHRM, McKinsey, and CompTIA data. It tells you what your engineering team actually costs, what your open roles are losing you, and what a smarter staffing model looks like in practice.
Download and get:
Download and get:
-
True fully-loaded cost per engineer — built from BLS, SHRM, McKinsey, and CompTIA data, not industry folklore
-
The real cost of every unfilled seat — quantified to the day, at your daily fully-loaded rate
-
A direct onshore vs. nearshore comparison — across nine operational metrics that actually matter to delivery firms
-
What high-performing firms are doing differently — and the structural staffing shift driving it
-
A framework you can use in your next leadership meeting — to model the cost and delivery impact of a nearshore-augmented team
5 minutes with this data will change how you price, staff, and pitch your next engagement.